
Better Rates, Fewer Homes: Santa Cruz One Year Apart
Good morning, Sand Club,
Every morning before the sun comes up, I track our local housing numbers by hand—single-family homes and townhomes/condos separately, area by area—using MLS and Altos Research data.

Check out my reel on Instagram
I do this because depending on how these numbers fall, it changes how I guide my clients or anyone considering a move. When the numbers align with what someone is trying to do—or when they don’t—we need to know where we stand. And because every neighborhood behaves differently, the countywide number is only the beginning.
This week, I want to show you what that looks like when we compare the same week one year apart.
The countywide median single-family price moved from $1,420,000 last summer to $1,498,000 this summer. Condos moved in the opposite direction, from $879,950 down to $799,000.
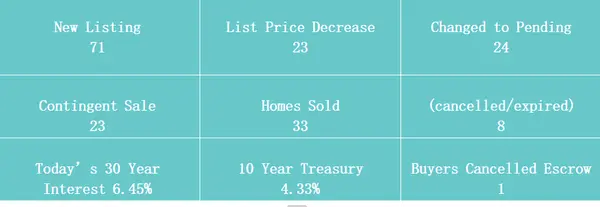
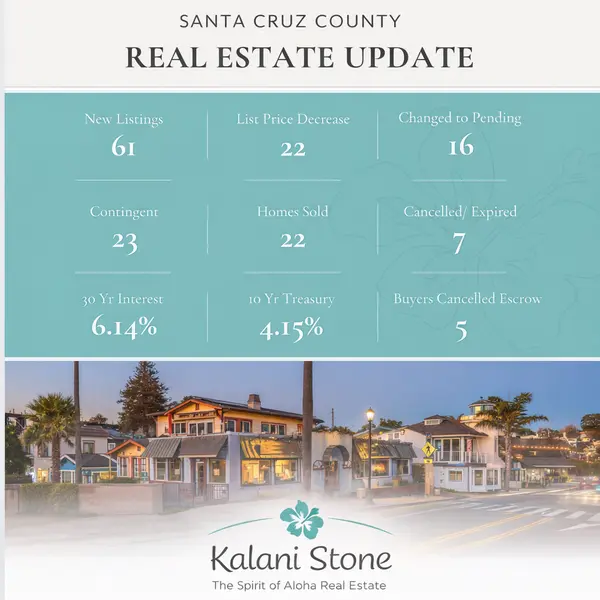
Rates improved from 6.75%–6.99% a year ago to 6.51%–6.57% now. Yet inventory fell from 622 homes on the market countywide to 492.
Better rates. About 130 fewer homes. That is a tension in our market right now.
But the county number only tells part of the story.
Santa Cruz 95060 rose from $1,595,000 to $1,685,000. Santa Cruz 95062 moved from $2,289,000 to $2,525,000. Scotts Valley held almost perfectly flat at approximately $1.590,000.
Aptos softened from $1,800,000 to $1,750,000. Capitola moved from $1,898,000 to $1,548,500, and Boulder Creek moved from $799,000 to $684,000. Ben Lomond, Felton, Soquel, and Watsonville were also down approximately 4%–8%.
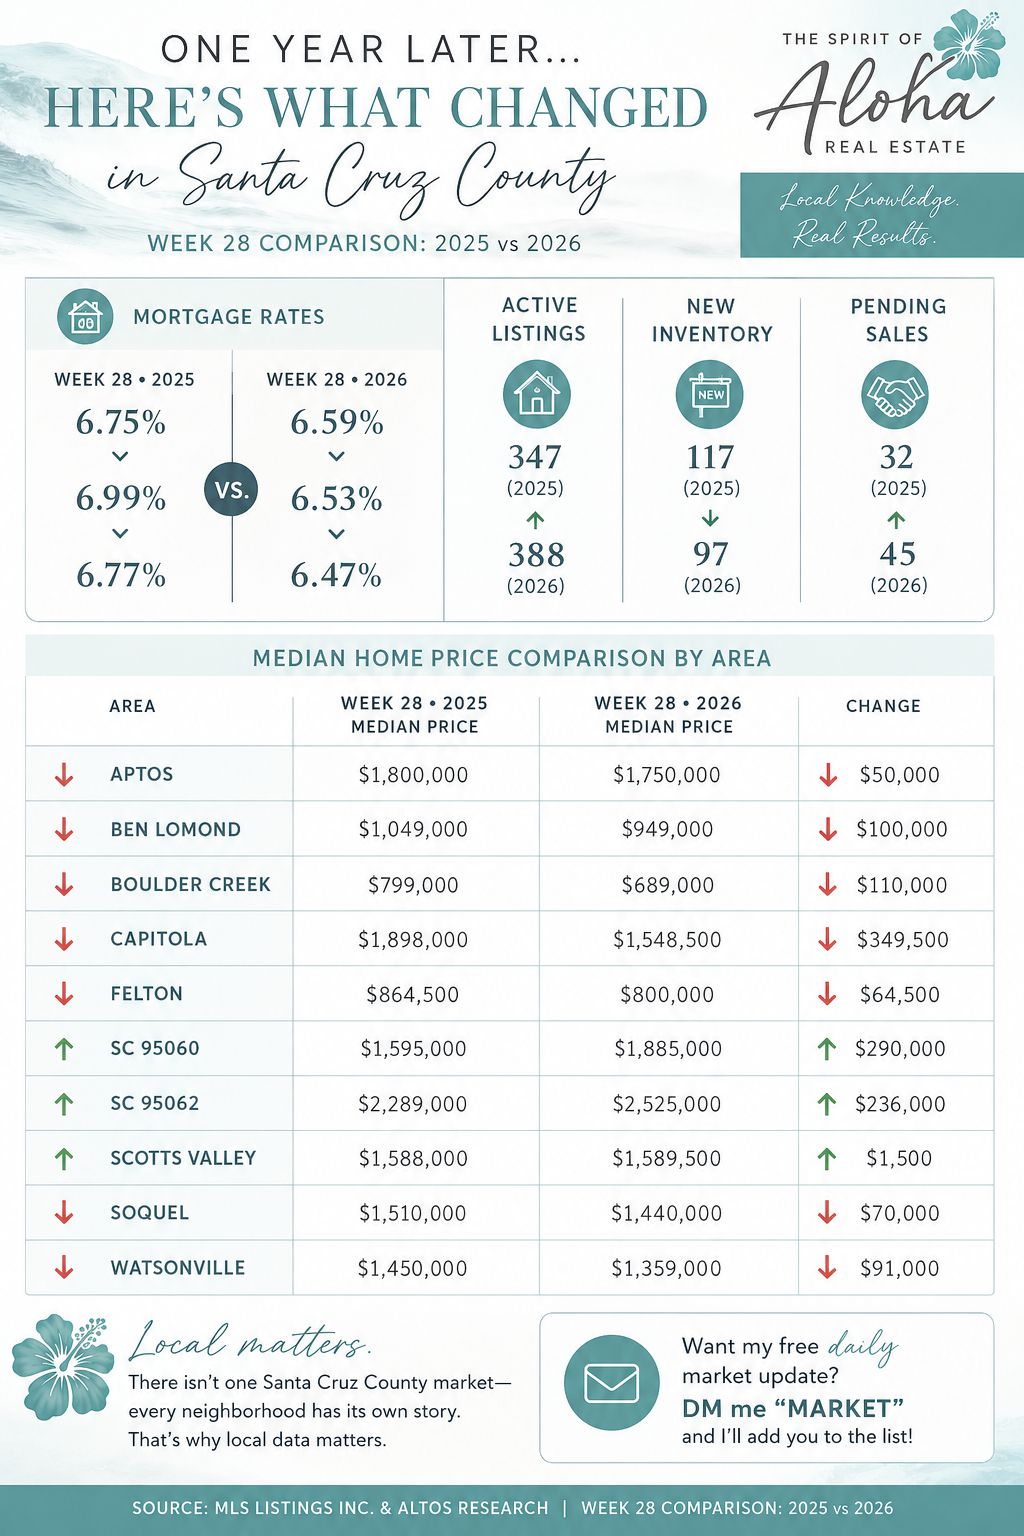
Three areas up. Seven areas are a little softer.
That is why I always say there is no single “Santa Cruz market.” There is your street, your neighborhood, your property type, and your specific comparable sales. The county median can be moving one way while your neighborhood is doing something completely different.
I don’t think what is happening here is isolated either. San Francisco’s median single-family price is up more than 20% year over year. When the metro markets north of us become more expensive and competitive, some of that pressure eventually finds its way south through relocators, investors, and buyers looking for another option.
Nationally, approximately 43% of mortgaged homes are considered equity-rich, meaning the owner owes half or less of what the home is worth. San Jose currently leads major metros at approximately 65%.
Nobody builds that kind of equity by waiting for the perfect month. They build it by buying when the time is right for their life, staying the course, and letting time and location do the work.
There is no good market or bad market. There is the market we are actually in. Things are harder for many people right now, and I’m not going to pretend otherwise. But harder doesn’t mean impossible. It means it takes a plan.
If you want to know what these numbers mean for your neighborhood and what you are considering, that is exactly the conversation I’m here for.
Kalani
Data sources: MLSListings Inc. and Altos Research. County and area comparison: Week 28, 2025 vs. 2026. National equity data: ATTOM Q1 2026 Home Equity & Underwater Report.
Guiding you home with Aloha

Touring this weekend? Here’s the one link you need: https://kalanistone.com/open-house
Want a quieter walkthrough? Book a private appointment
Sources: Redfin, Realtor.com, mysantacruzrealestate.com, and local MLS stats November 2025.
Categories
Recent Posts

GET MORE INFORMATION

Agent Lic# CalBRE: 01336392